
Email Campaign Metrics: Formulas, Benchmarks and Reporting Examples
An email report should tell you what to change next. Start with attempted sends, accepted messages, distinct recipients who acted, and the business outcome you wanted. Calculate rates from the underlying counts, use a fixed reporting window, and keep newsletters separate from prospecting sequences.
The worked examples below show how a report can look successful while answering the wrong question. You can reproduce the arithmetic in the email metrics worksheet or download the sample campaign CSV. All example results are illustrative, not measured Leadz customer outcomes.
Define the audience and counting window first
A campaign to existing customers has a different starting relationship from a first approach to an unfamiliar business. Reporting both as “email marketing” conceals that difference. Give each row a campaign type, audience rule, sending period and observation cutoff. A useful label might be “September customer newsletter, active subscribers, replies counted through September 30.”
For prospecting, also distinguish a message from a person and a person from an account. One business might receive two messages addressed to one employee. That is one account, one recipient and two attempted messages. A reply should stop further scheduled messages to that person while the conversation is handled. Without those definitions, a follow-up can enlarge the denominator while an earlier reply remains in the numerator.
Choose the unit that matches the decision. Message-level delivery reports help investigate sending problems. Recipient-level sequence reports help assess contact and message relevance. Account-level reports help decide whether the business segment is worth pursuing. Keep the units in separate columns rather than mixing them into one conversion rate.
Save a copy of the source export when you close a reporting period. Note the timezone and whether the report includes events that arrived late. Someone might reply on Friday to a message sent the previous Monday. Counting that reply in the next week's numerator while dividing by the next week's sends creates a cohort mismatch.
If you need a starting record layout, the business contact CSV field guide explains how to carry account and contact information into a working file. Add campaign measurements in your sending or reporting system; a contact record itself does not tell you whether a message was delivered or read.
Use formulas with explicit numerators and denominators
The following definitions work for a campaign where each recipient receives one message. A sequence with repeat sends needs the separate recipient view described above.
Metric | Calculation | What the result describes |
|---|---|---|
Acceptance rate | Accepted messages ÷ attempted sends × 100 | Messages accepted according to your provider's reporting definition |
Bounce rate | Bounced messages ÷ attempted sends × 100 | Attempts recorded as bounced by the cutoff |
Click-through rate | Distinct clickers ÷ accepted messages × 100 | Recipients with a counted click per accepted message |
Human reply rate | Distinct human repliers ÷ accepted messages × 100 | Recipients who sent a human response |
Qualified reply rate | Distinct qualified repliers ÷ accepted messages × 100 | Recipients meeting your written qualification rule |
Unsubscribe rate | Distinct unsubscribers ÷ accepted messages × 100 | Recipients who asked to leave this audience |
Your platform may define “delivered” or click rate differently. Preserve its original field name in the export and document the mapping. If you change the denominator from sent to accepted messages, the percentage changes even when the campaign does not.
For example, 20 clickers from 1,000 attempts produce a sent-based click rate of 2%. If 950 messages were accepted, the accepted-message rate is 20 ÷ 950 × 100, or 2.11%. Neither calculation is mysterious; the misleading step is comparing them without noticing the denominator.
Acceptance also does not establish inbox placement. A receiving system can accept a message without placing it in the recipient's main inbox. Avoid renaming an acceptance field “inbox rate.” Likewise, missing delivery events do not automatically mean a bounce: some messages may still be pending or have incomplete reporting. Reconcile the statuses before interpreting the percentage.
Store the numerator and denominator beside each displayed percentage. A rounded rate of 2% cannot tell a reviewer whether you observed two responses from 100 recipients or 200 from 10,000. Keeping the counts also lets you recalculate the report when a late delivery event changes the accepted-message total.
When the denominator is zero, display “not available.” Zero percent means you observed a denominator and no qualifying event. An unavailable rate means you cannot make that calculation.
Combine campaigns without giving small sends extra weight
Suppose you send two newsletters to subscriber groups. The numbers below are the same teaching example used in the downloadable worksheet.
Measure | Campaign A | Campaign B | Combined |
|---|---|---|---|
Attempted sends | 1,000 | 100 | 1,100 |
Accepted messages | 950 | 90 | 1,040 |
Distinct clickers within each campaign | 38 | 9 | 47 |
Campaign click rate | 4.00% | 10.00% | 4.52% pooled |
A simple mean of the campaign rates is (4% + 10%) ÷ 2 = 7%. That tells you the average rate across two equally weighted campaigns. It does not tell you the overall rate across their accepted messages.
For the pooled rate, sum the counts before dividing: (38 + 9) ÷ (950 + 90) × 100 = 4.52%. The larger campaign contributes more because it represents more messages. In a spreadsheet, the basic calculation is SUM(clickers) / SUM(accepted) with percentage formatting.
Decide which question you are answering before choosing a summary. The equal-weighted mean can describe a typical campaign in a deliberately balanced experiment. The pooled rate describes the combined message volume. A median describes the middle campaign when rates are sorted. These are different summaries and can all be valid when labeled correctly.
There is one more trap. If the same person appears in both campaigns, 47 summed campaign clickers may not represent 47 people. Suppose six people clicked in both. The period then has 41 distinct clickers, but you still need the number of distinct accepted recipients before calculating a unique-person rate. Do not divide 41 people by 1,040 messages and call it audience engagement.
Use stable recipient identifiers to deduplicate across campaigns. If you only have campaign totals, report the pooled message-based measure and state its scope. Do not invent a person-level result from aggregate data.
Put 2026 benchmarks in their proper context
MailerLite's 2026 email benchmark report, published December 3, 2025, uses more than 3.6 million campaigns from 181,000 approved accounts, measured from December 2024 through November 2025. Its methodology specifies medians, although parts of the article use “average.” Overall benchmarks include 2.09% click rate, 43.46% open rate and 0.22% unsubscribe rate.
Those are useful reference points for that platform's email-marketing population. They are not measurements of campaigns sent during 2026, and they are not a forecast for unsolicited business outreach. MailerLite's anti-spam policy requires permission-based audiences and disallows purchased lists.
If a benchmark leaves one of those details unclear, use the number as a question to investigate rather than a pass/fail threshold.
A newsletter with multiple article links and a first-contact message asking for a reply have different jobs. The latter could receive useful replies without a single click. Adding unnecessary links merely to improve click rate would make the report look more active without serving the recipient or your campaign objective.
Treat opens and automated activity carefully
An open-tracking event is a technical observation, not proof that a person considered your offer. Apple's Mail Privacy Protection documentation explains that the feature prevents senders from learning whether someone opened a message. That makes open-based interest scoring unreliable for affected recipients.
Click-to-open rate also inherits uncertainty from its denominator. Dividing counted clickers by counted opens does not repair unreliable open detection. If you retain the metric for historical reporting, show the platform definition and avoid treating it as a precise measure of how persuasive the body copy was.
For clicks, inspect your sending platform's definition of automated activity and use a consistent filtering setting. A sudden cluster of immediate clicks deserves investigation before sales teams treat it as interest. Check whether the click led to a meaningful website action, but remember that privacy settings and attribution gaps can prevent some genuine visits from being connected.
Separate automated replies from human replies. An out-of-office notice confirms neither interest nor a requested follow-up. A rejection notice is not a human response. A short “please remove me” is a human reply, but it is an opt-out rather than a qualified lead. Keep these distinctions in the raw classifications so later reporting can be checked.
Sending health belongs next to engagement. Google's personal Gmail sender requirements include authentication and additional obligations for bulk senders. Check the requirements that apply to your setup and monitor the corresponding provider reports. A marketing dashboard cannot substitute for that operational check.
Follow replies through to a business outcome
Choose a qualification rule before reading the results. For a project-photography agency, “qualified” might require a relevant architecture practice, a person involved in selecting photography, and an expressed willingness to discuss an identifiable project or planning need. A friendly reply alone does not meet that rule.
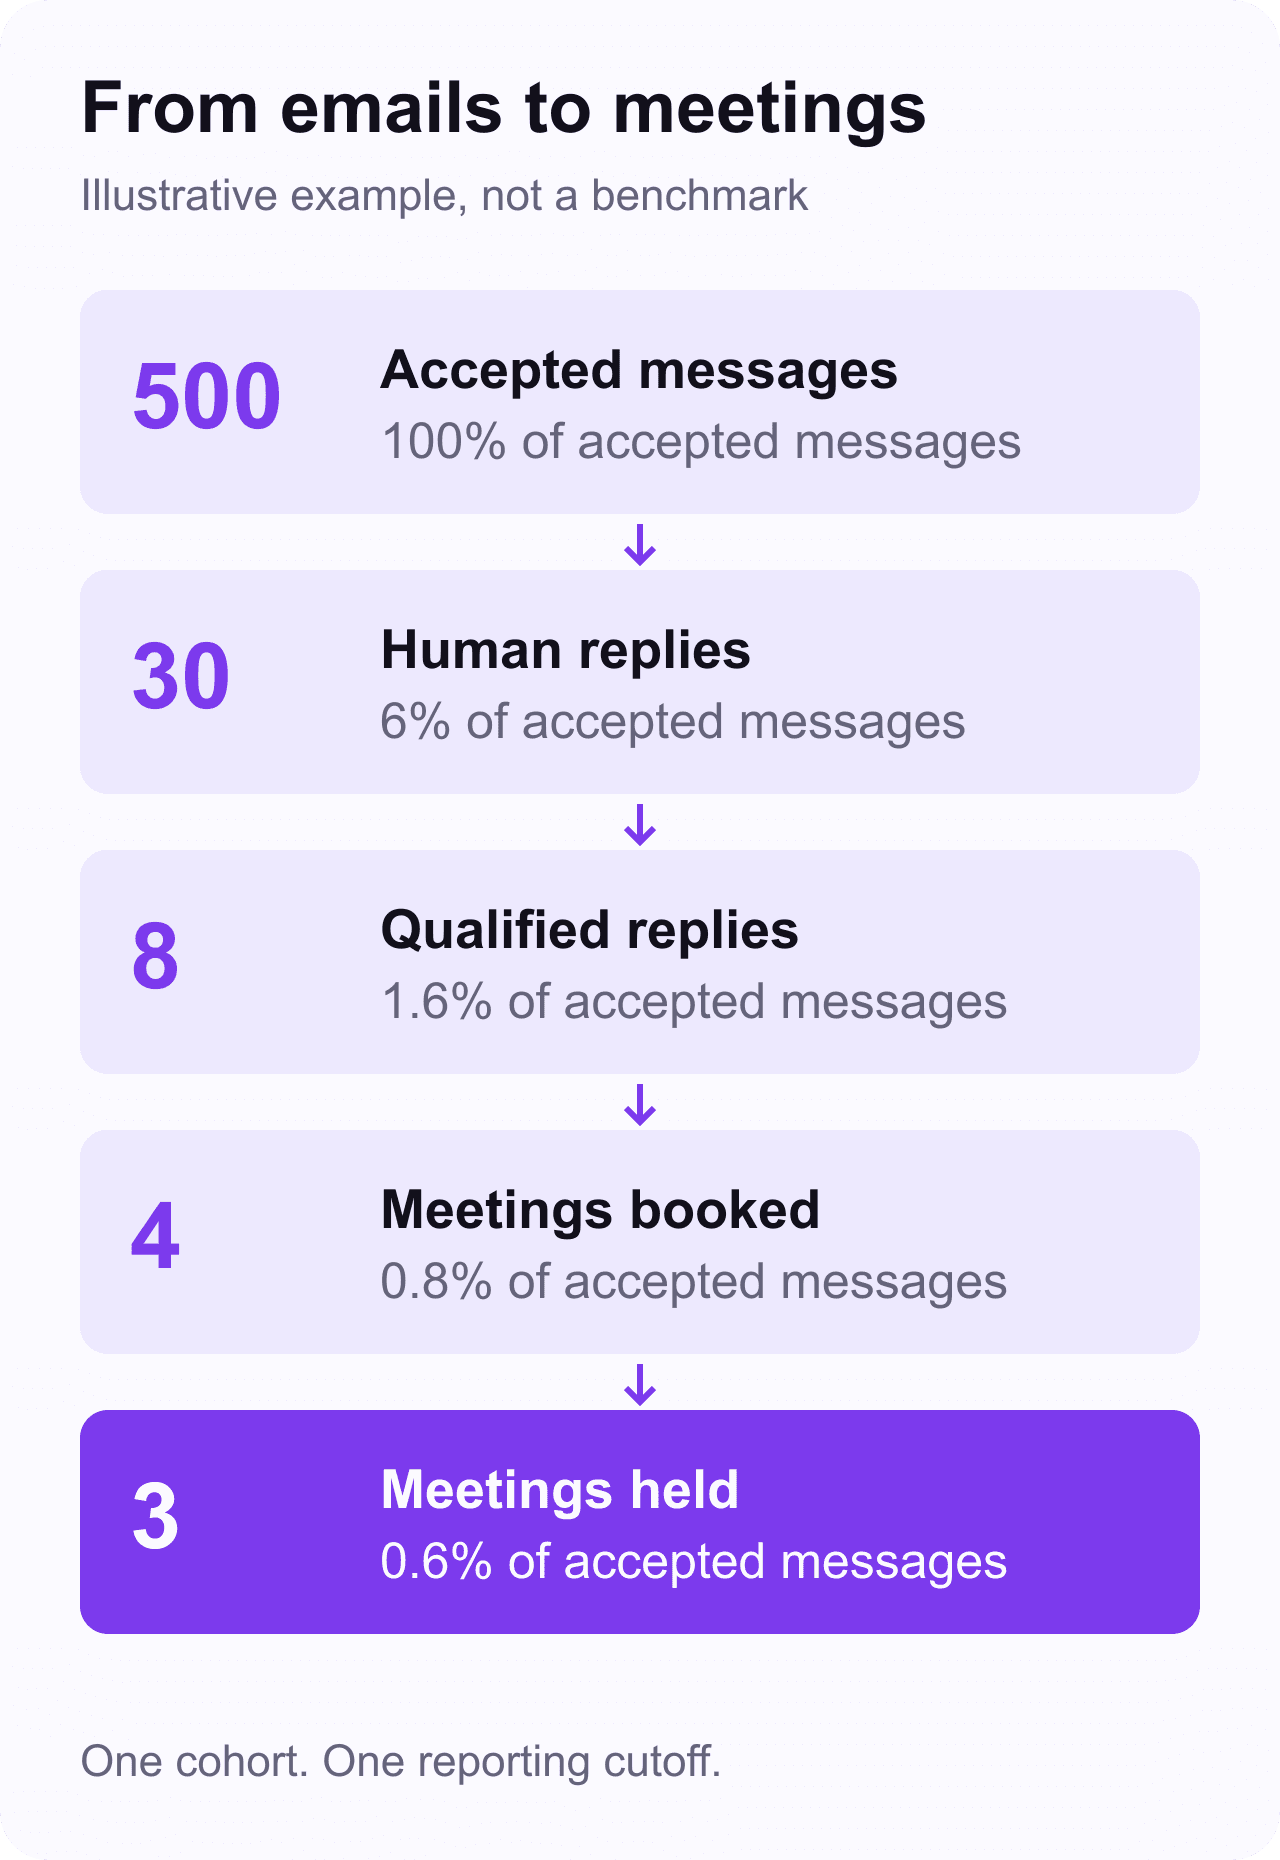
Consider a second illustrative campaign with 500 accepted messages to distinct recipients:
30 recipients send human replies.
Of those, eight meet the qualification rule.
Four of the qualified contacts book a meeting.
Three meetings take place by the reporting cutoff.
The human reply rate is 30 ÷ 500 = 6%. The qualified reply rate is 8 ÷ 500 = 1.6%. The share of human replies that qualify is 8 ÷ 30 = 26.7%. Those percentages answer different questions; name them accordingly.
The booked-meeting rate is 4 ÷ 500 = 0.8%, while the held-meeting rate is 3 ÷ 500 = 0.6%. Report both counts. Otherwise a calendar full of cancellations can look like a successful campaign. If the fourth meeting is scheduled after the cutoff, mark it pending rather than a failure.
Now suppose the campaign cost $600, including the sending expense and allocated research labor. Cost per qualified reply is $600 ÷ 8 = $75; cost per held meeting is $600 ÷ 3 = $200. These are illustrative unit costs, not market benchmarks. Document what the cost includes so another campaign can be compared fairly.
Revenue needs an additional time window. A project might close weeks after the initial contact. Keep the originating campaign identifier with the opportunity and report booked revenue, collected revenue or gross profit explicitly. Do not describe an open proposal as realized revenue. If multiple campaigns touched the same account, use a stated attribution rule rather than crediting every campaign with the entire sale.
The lead qualification guide helps define account fit and role evidence. The worked outreach sequence shows the reply categories that feed this report.
Run a weekly review that ends with one decision
Build the review around a consistent set of rows: cohort, date window, attempts, accepted messages, distinct clickers, human replies, qualified replies, meetings booked, meetings held, opt-outs and cost. Keep a notes column for changes to audience selection, sender setup or the offer.
Read from the earliest possible failure forward. If messages were rejected, investigate sending or address problems before rewriting the CTA. If replies repeatedly say “wrong department,” revisit contact research. If relevant recipients understand the offer but say it does not fit, review the offer or account criteria. If meetings happen but opportunities stall, examine the handoff and sales conversation.
For poor account fit, review a small contact sample against the same inclusion rules used in the campaign. A category such as architecture businesses is a starting inventory, not evidence that every listed firm needs project photography. Qualification has to happen at the record and account level.
Choose one material adjustment where practical, and record why. Keep the previous definition of success so a disappointing result cannot be rescued by changing the metric afterward. If you change audience, message, timing and offer together, treat the next result as a new campaign rather than an isolated test of the subject line.
Small cohorts need particular restraint. Moving from two replies to four in 100 accepted messages doubles the rate, but it adds only two observed people. Report the counts and collect more comparable evidence before declaring a reliable improvement. If the underlying account selection changes, explain that too.
Finish by assigning the next action and its owner. “Improve engagement” is too vague. “Check the role evidence on the 12 wrong-person replies before choosing the next cohort” can be completed and evaluated. The purpose of the worksheet is to make that next decision easier, not to produce the largest percentage on a slide.